

This is my explanation of how I drew the maps. My goal with this explanation is to convince you that I have done everything possible to avoid subconscious bias resulting in unintentional gerrymandering. You can see every map for free here at Dave’s Redistricting.
To start, I threw out the existing Congressional district map. The existing map is 435 single member districts, gerrymandered all over the place. The new map would have 695 representatives across some number of multimember districts.
Except for the smallest states which are assigned a single district of just 1 or 2 representatives, each district would have between 3 and 5 members, with a top preference of 5 members per district, followed by 4 members per district, followed by 3 members per district. I prioritized maximizing the number of 5 member districts as I believe that is the best electoral threshold to allow alternative parties to win while simultaneously requiring winning candidates to have reasonably widespread support. I experimented with the possibility of districts of 6 or 7 members, but decided against that as such districts would have too low an electoral threshold (further explored in Chapter 8.b.iv).
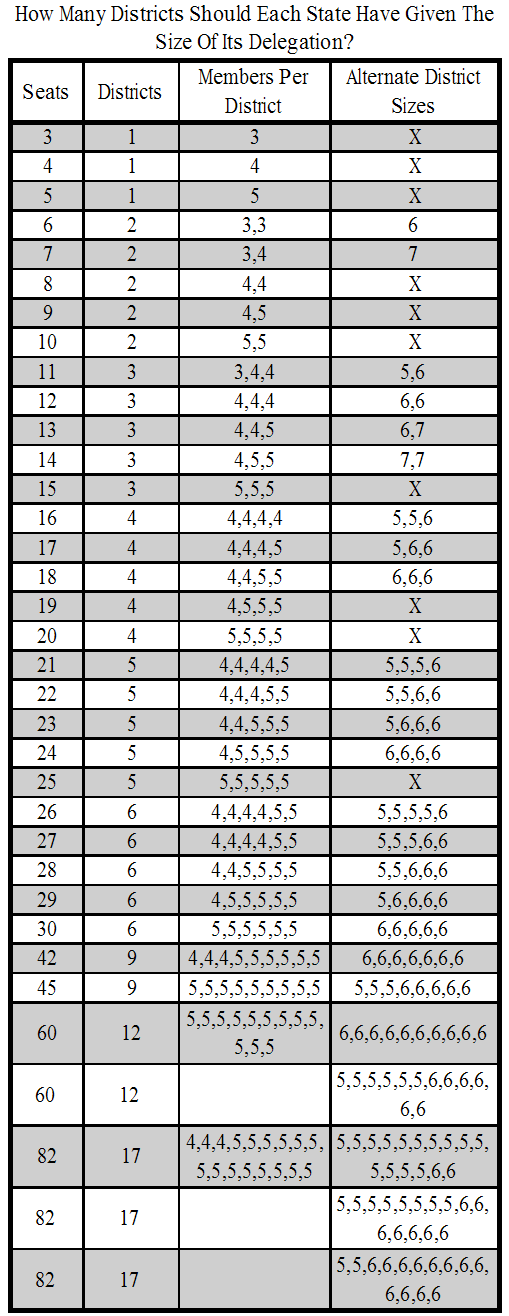
Moving the theory into practice, I determined how many districts each state would have, and how many seats each of those districts would have, as shown in the table below.
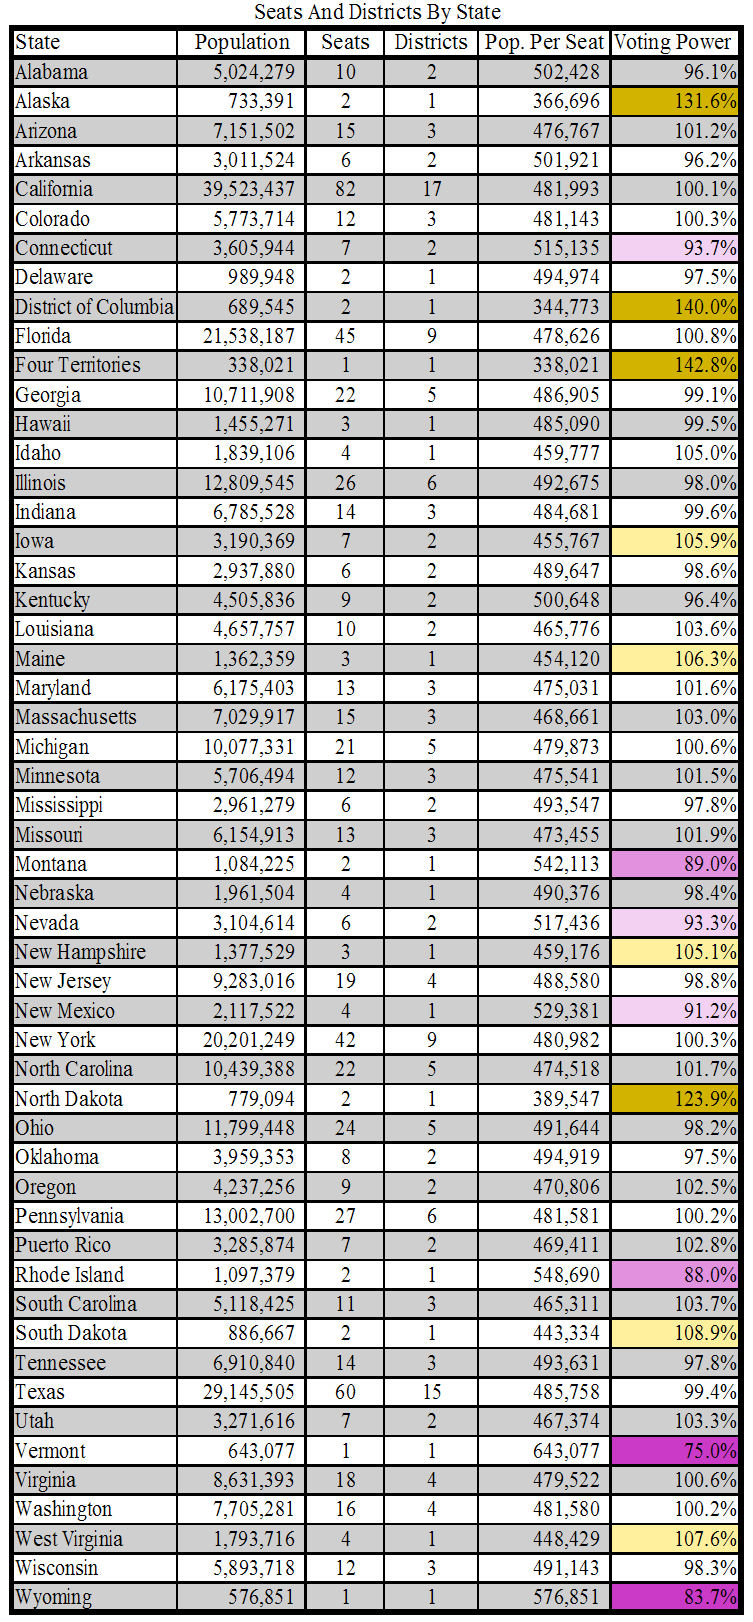
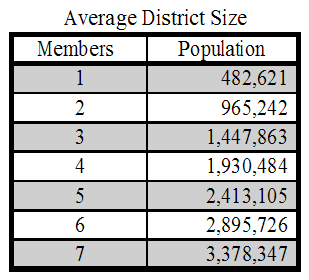
As discussed in Chapter 5.c, there would be an average of 482,621 people represented by each member of Congress. When drawing multimember districts, a three member district would have a baseline population of 1.4 million people, shown in the small table below. A four member district would have a baseline population of 1.9 million people, and a five member district would have a baseline population of 2.4 million people. The exact size of the districts varies state to state, depending on the voting power of each state. For example, Alabama would be assigned 10 seats in a 695 member Congress, which would be drawn into 2 five member districts. The 502,428 people per representative in Alabama would have 96.1% voting power, slightly less than average. Each of the five member districts in Alabama contains just over 2.5 million people. Within each state, the number of people represented by the same size of district should be the same. In practice, my districts are not perfectly proportional; they are almost all within 1,000 people of the population which they are supposed to be. If multimember districts were implemented, they would be drawn to perfection; my purpose here is to provide a close enough estimate to make the point. All the data for the size of each district is shown in each state’s section in Chapter 8.
Once I determined how many districts each state would be divided into, and how many members each district would have, I started drawing the lines. I used the Dave’s Redistricting platform to draw all the new maps; Dave’s Redistricting has precinct level population data for every precinct in every county in every state.
I redistricted each state independently of all others. I discuss the particulars of each state’s redistricting in the relevant section in Chapter 8.
In general, I used a state’s existing legislative district lines as a guide for where to divide communities that I know little about other than their population and location on the map. State legislative lines are to some extent gerrymandered, which is why I only used them as guidelines. I usually started in one corner of a state and then moved across it. For example, in drawing New York’s lines I started at the eastern edge of Long Island, then moved through New York City, then moved into upstate New York; for Florida I started in the panhandle and moved south to Miami. Each state presented unique challenges, which I discuss on a state by state basis in Chapter 8. I also tried to make districts as compact as possible to avoid creating the bizarrely shaped districts that exist in our current system. Ultimately, drawing the districts came down to dozens of judgment calls. Which precinct should be in this district as opposed to a different district? It was a puzzle that came down to trying to balance the population of the different districts.
My districts are not meant to be perfect. They are far from perfect. But they are a clear improvement on the gerrymandered mess of our current system. Since most districts have four or five members, there are around 1.9 million or 2.4 million people in each district. It is extremely difficult to gerrymander such districts because it is difficult to find 2 million people living in such locations that could be gerrymandered. Additionally, with a lower electoral threshold of 17 or 20 percent, it is practically impossible to draw districts in such a way as to deny political power to one of the two major parties. The only places this is possible is in the very most liberal parts of New York and San Francisco, and even in those places conservative voters would have a greater chance of electoral success, as well as alternative parties on the left having the potential to disrupt the dominant Democratic Party.